by Annalisa de Stefano, published first under: https://annalisadestefano.com/blog/creare-contenuti-coinvolgenti-con-ga4/
If you own a blog or manage a website with an editorial section, you surely understand the importance of creating engaging, high-quality content to attract and convert your target audience. When planning a content strategy and approving an editorial plan, we typically rely on the interests, needs, and inquiries of our target audience. However, once we start publishing content, we have the opportunity to strengthen and optimize this strategy through the data gathered from published content.
Understanding which topics and content formats are performing best, and which are underperforming, can be incredibly useful for optimizing future content and achieving better results. So, how can we obtain this information? Well, this is where Google Analytics comes into play! With this free platform that tracks user behavior on your site, you can monitor the performance of your content and optimize your marketing strategy.
In this article, we’ll explore the ways you can utilize Google Analytics to analyze report data and enhance your content strategy. Let’s uncover the full potential of content optimization with Google Analytics!
The Importance of Creating Engaging Content
Creating content that captivates your audience is essential for your blog or website to succeed. It helps you figure out what content people like and what they don’t. This way, you can focus on making more of the good stuff and ditching what doesn’t work. By doing so, you can allocate your time and resources toward generating fresh, effective content while discarding themes or formats that have proven unsuccessful.
Google Analytics is a tool that can show you lots of useful information, like how many people look at your content, how long they stay, and whether they leave quickly. Plus, when you provide interesting content, it makes your website more enjoyable for visitors. They’ll spend more time there and might check out other things you offer, especially if you’re selling online. This makes it easier for them to reach out to you or make a purchase.
And here’s a bonus: making your content better can also help your website show up higher in search results. If your content matches what people are searching for, is optimized for the right keywords, and your website is easier to use and more interesting than others, Google might put you higher on the SERP.
Essential Google Analytics Reports for Content Analysis
Using Google Analytics to analyze content performance is easier than you might think.
1. On Page Behavior
First, log into your GA4 account and go to “Reports > Engagement > Pages and Screens”.
Here, you’ll see a list of all your website’s pages, sorted by the number of views. This section helps you understand which content is successful and which isn’t. You can filter the displayed pages using the filter above the table to evaluate blog content or a specific site section. But there is more.
Google Analytics also lets you analyze other factors to see if users stayed engaged with the content after arriving.
Some useful Key Performance Indicators (KPIs) for this purpose, found in the ‘Pages and Screens’ report, include the ‘average engagement duration’ on the page, ‘views per user,’ and ‘events’ recorded on the page.

2. Optimizing User Experience: Landing Pages Analysis
Other interesting KPIs are the average session duration, bounce rate, and views per session. In GA4, the average session duration is called “Average engagement time per session” and can be found in the “Reports > Engagement > Landing Page” report, listing the pages that were the entry points for sessions on your site.

3. Events and Conversions
Don’t forget to use the “Events” feature to track user interactions with your content. For instance, scrolling action is automatically tracked by GA4 and can provide insight into whether users indeed scrolled through the page you’re analyzing.
Alternatively, you can create events tied to page interactions, such as clicks on call-to-action buttons, clicks to open additional tabs for further reading, or anchor links that direct users to specific sections of the page (like the beginning of this article). These data can help you understand if, how, and to what extent users have engaged with your content.
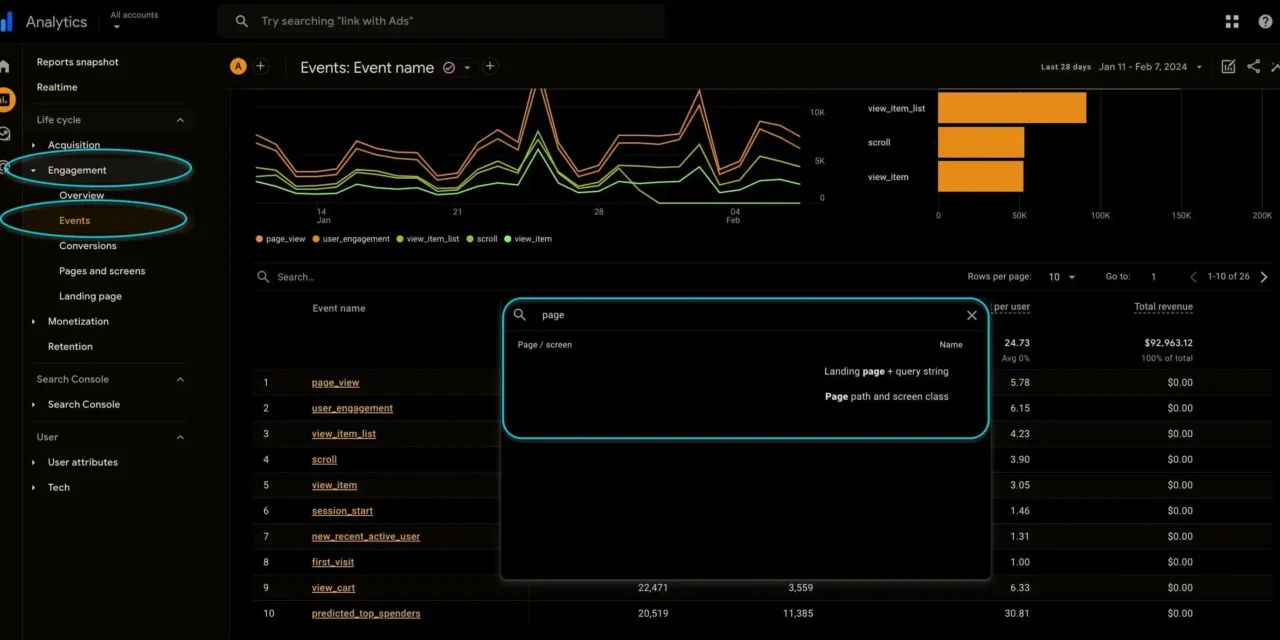
To access these data, go to the “Reports > Engagement > Events” section and add one of these the following dimensions as a secondary dimension to the table (by clicking the “+” next to “Event Name”), depending on the pages you wish to analyze:
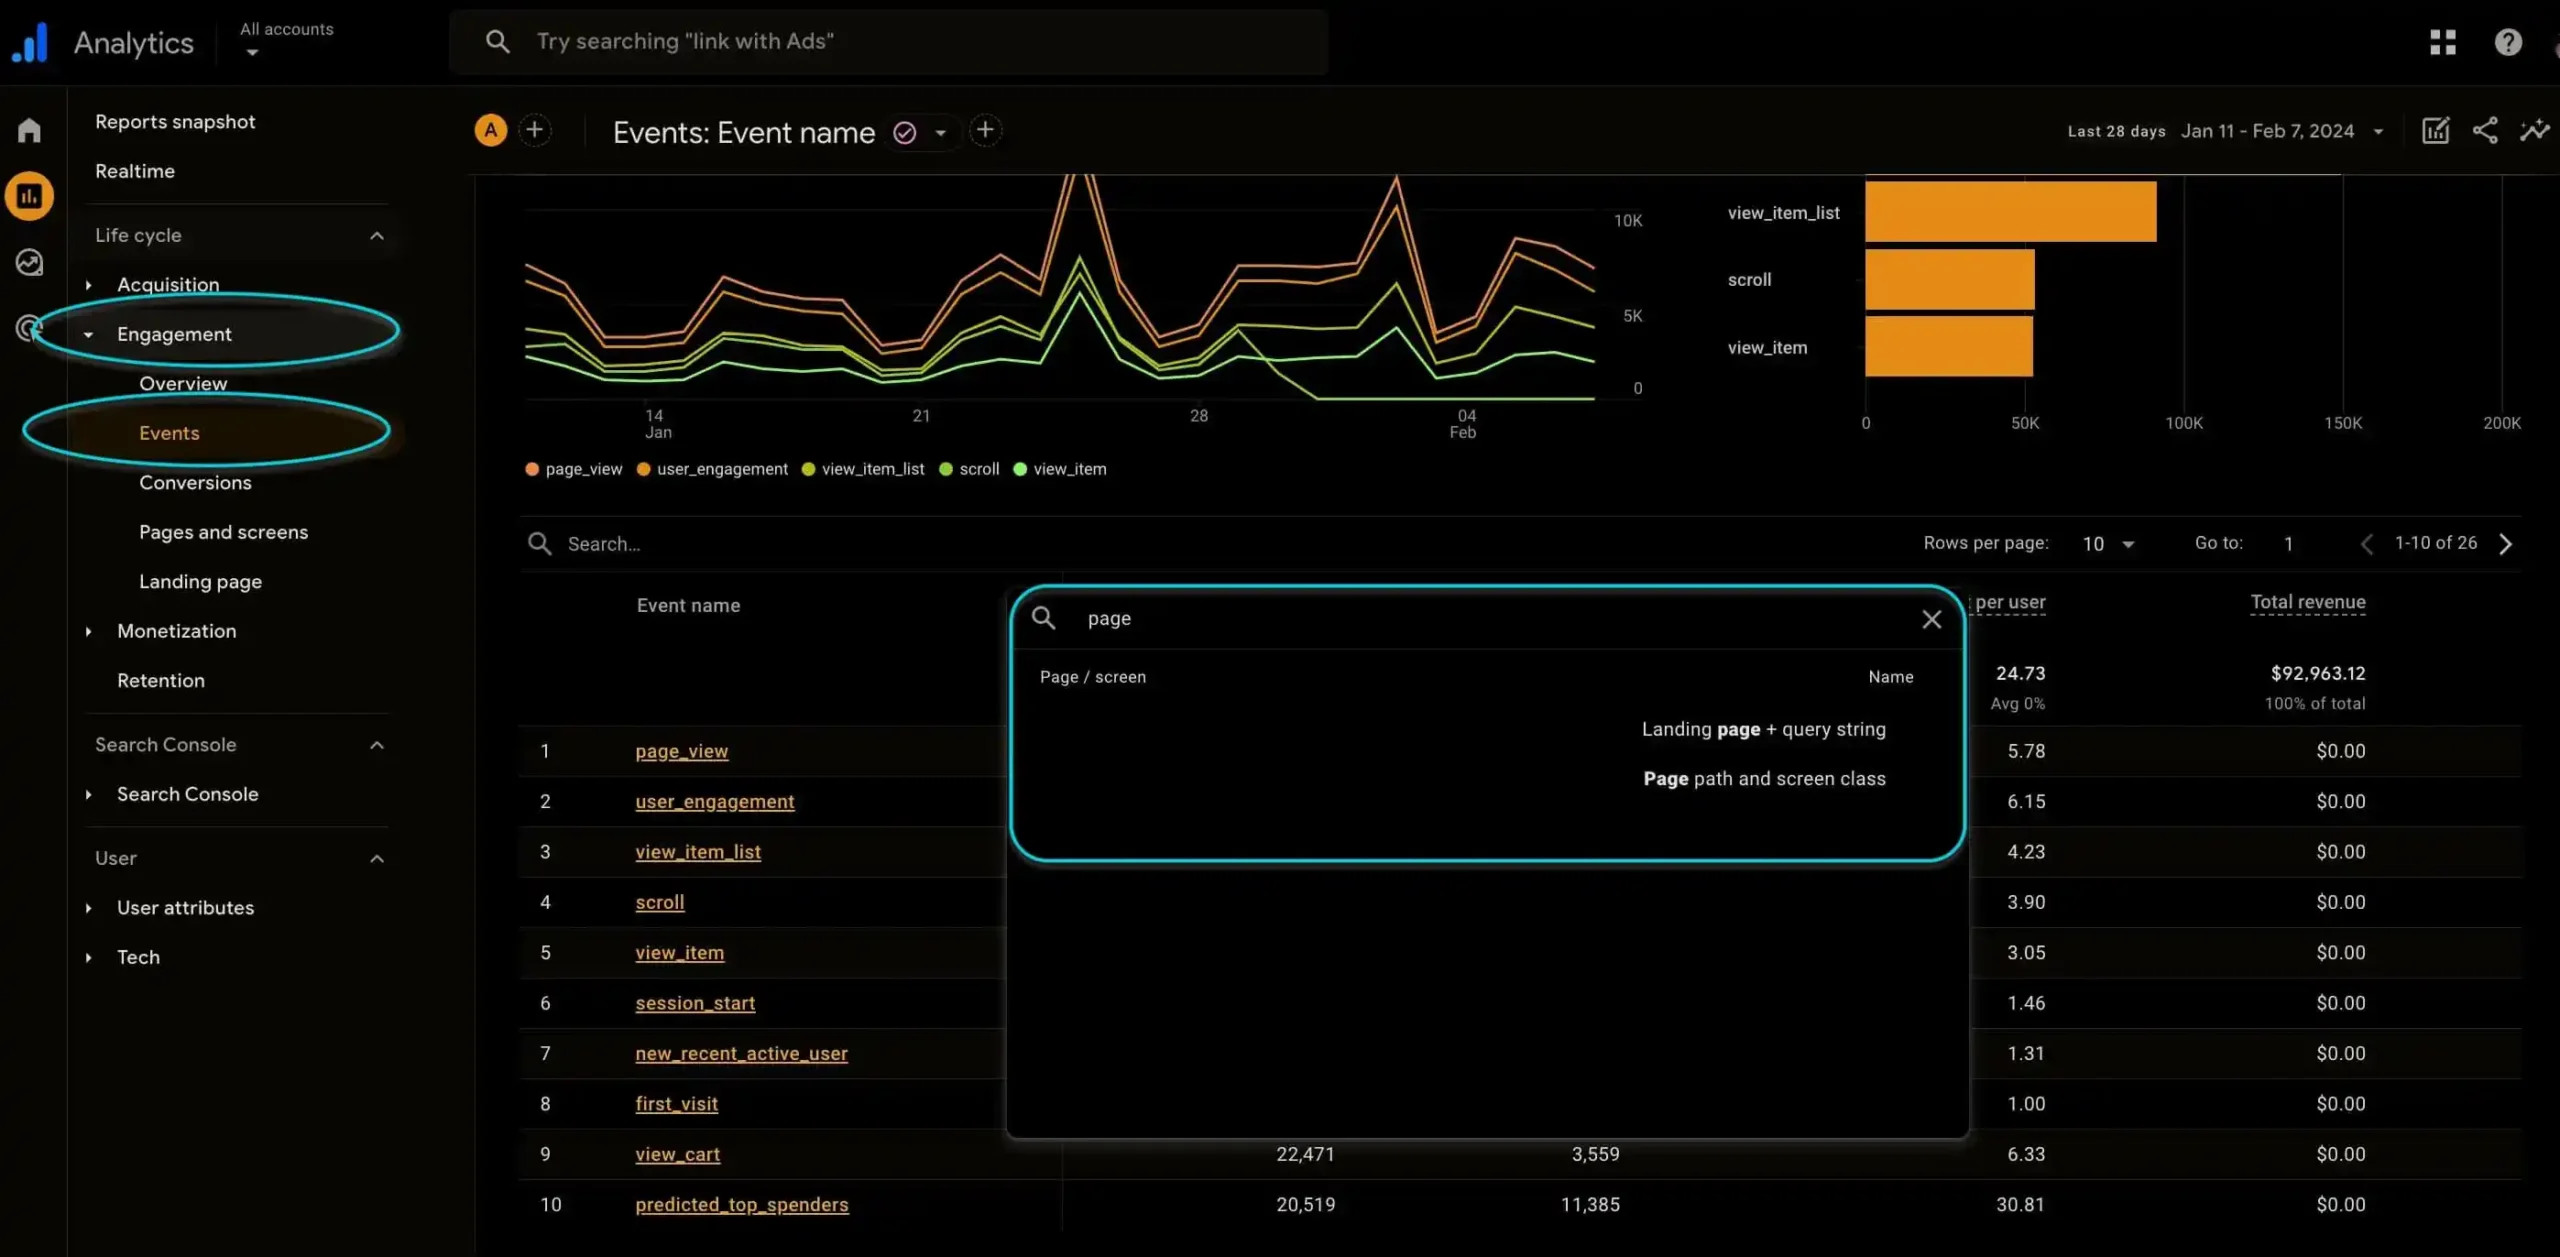
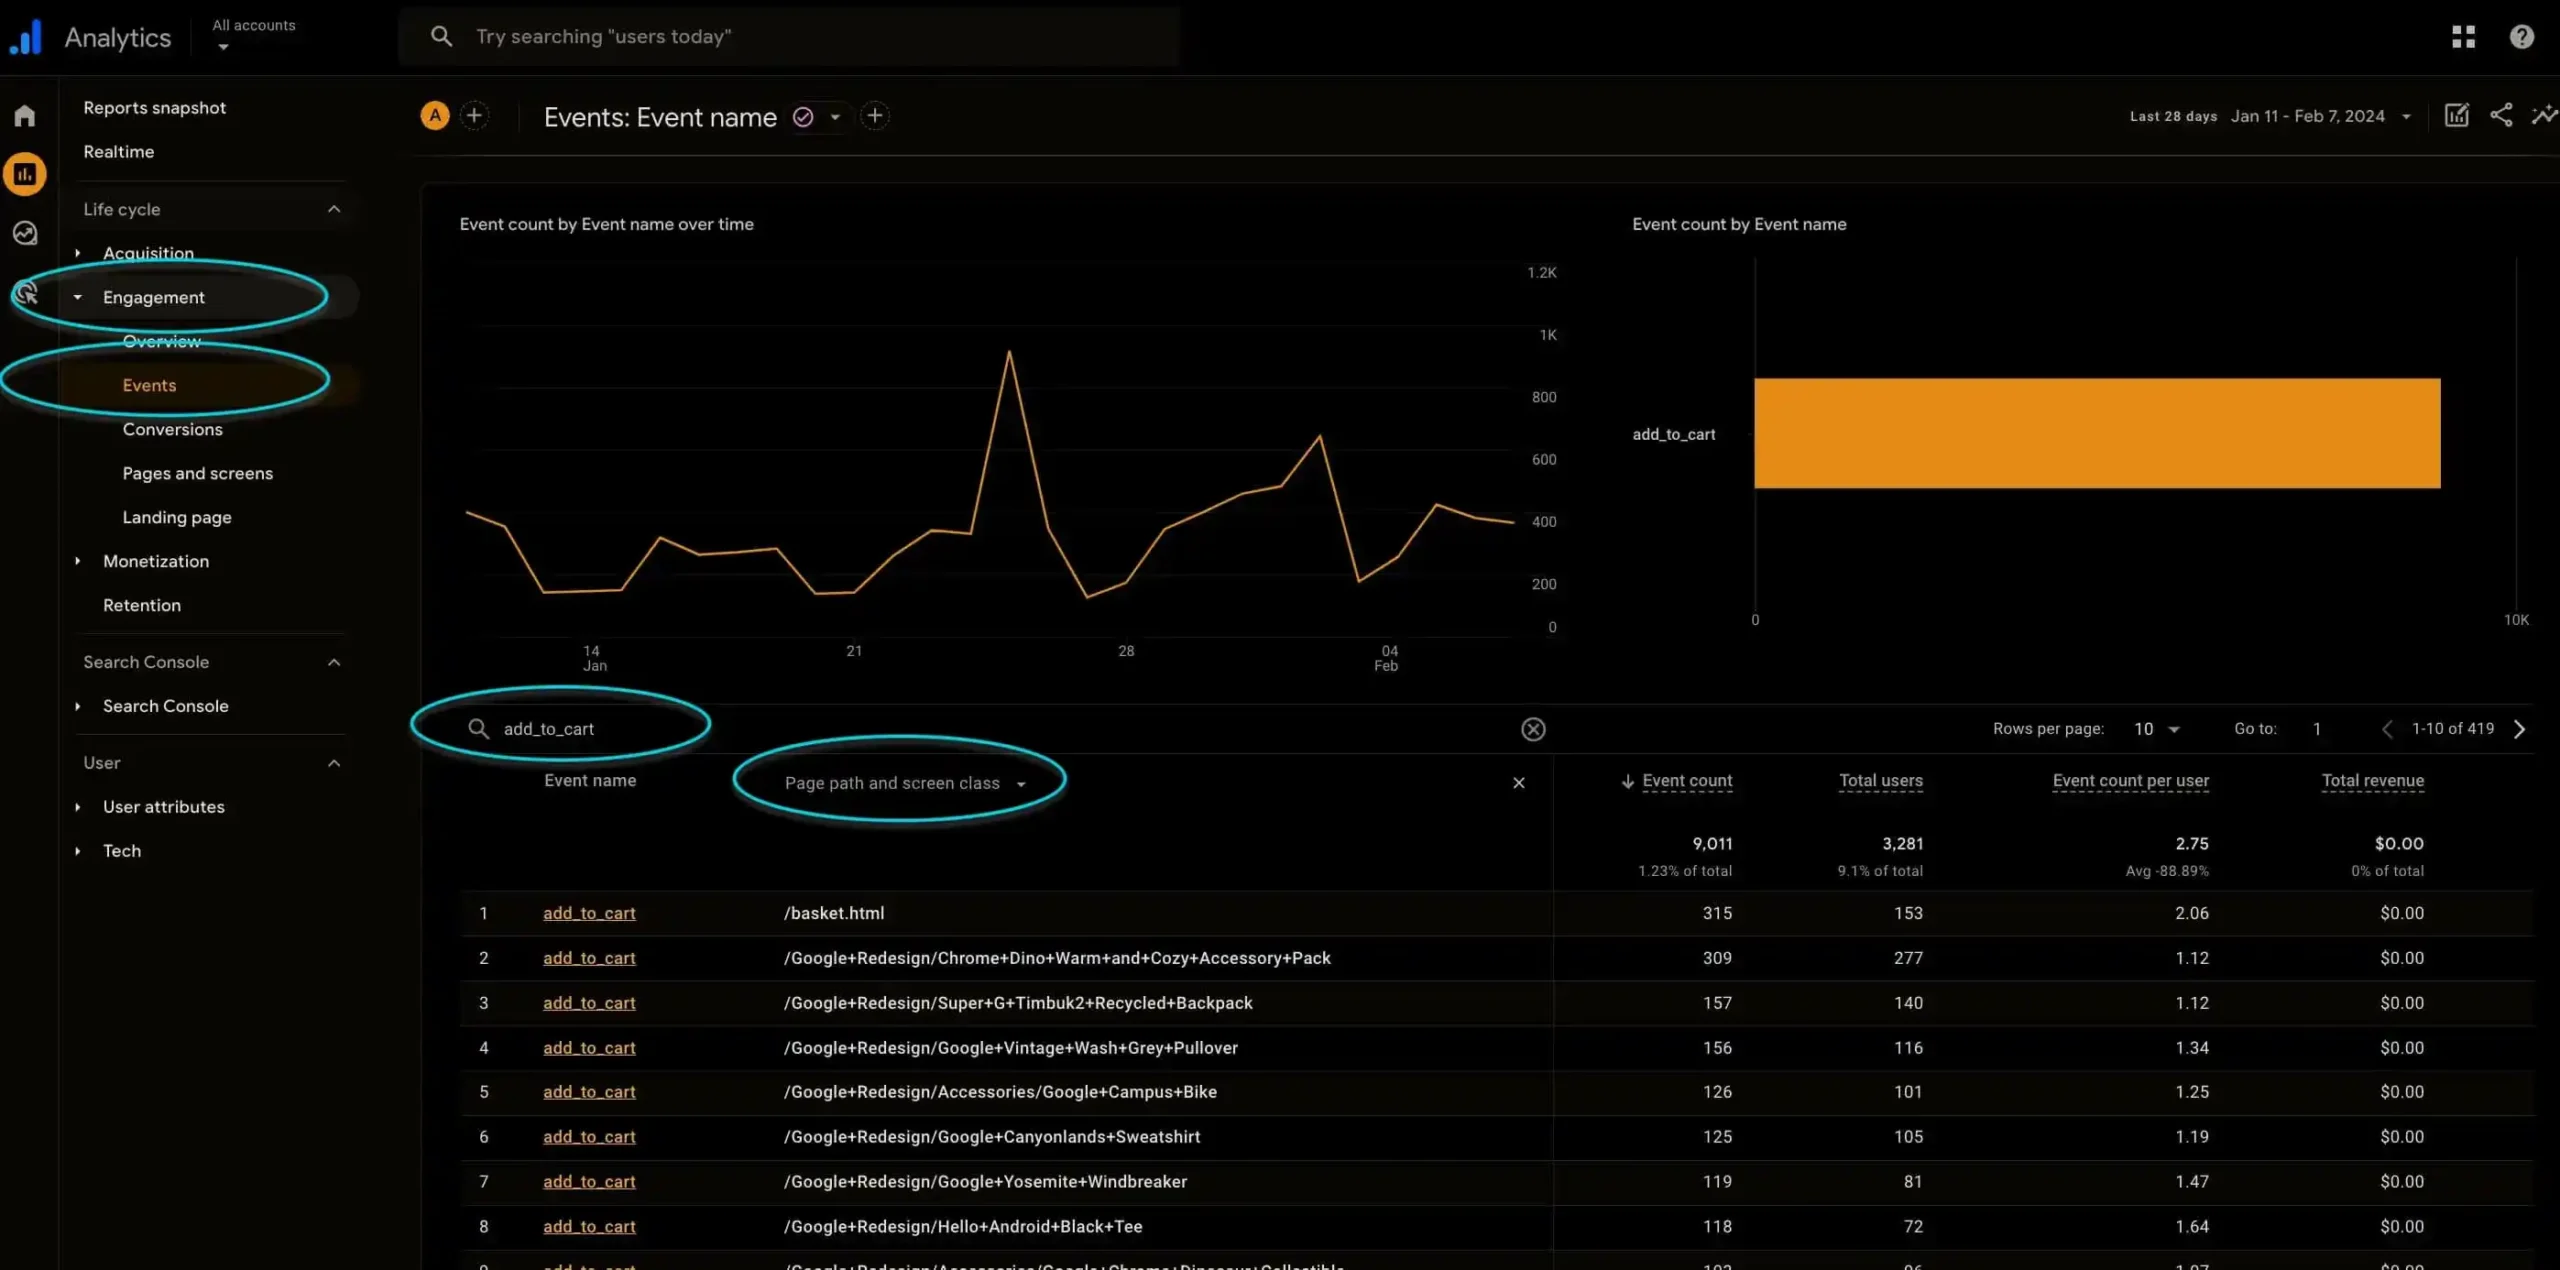
- Path Page and Screen Class: aenables analysis of events based on individual pages of the site, with data referring to specific pages.
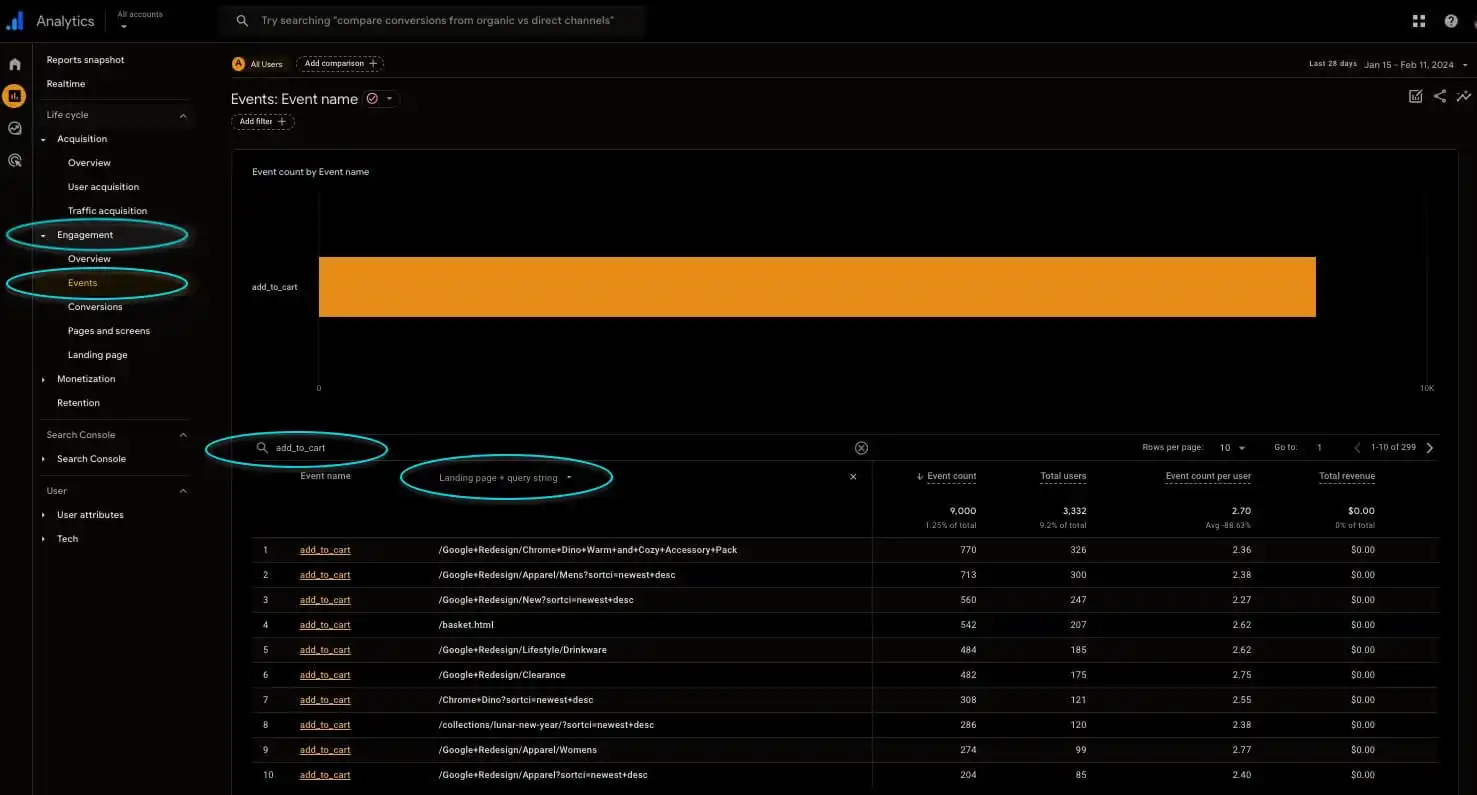
- Destination Page + Query String: facilitates analysis of events based on entry pages to the site, with data referring to entire sessions.
GA events track actions taken on the site and can be labeled as “Conversions” when they align with actions valuable to your business, such as purchases or contact requests.
In both the “Pages and Screens” and “Destination Pages” reports, you’ll also find a “Conversions” column. In the “Pages and Screens” report, you’ll discover the total (and detailed) conversions completed by users on specific pages. For pages containing newsletter sign-up forms, contact forms, videos, or downloadable files tracked as conversions, you can identify which content prompts user action.
On the other hand, the “Destination Pages” report provides the total number of conversions completed in entire sessions initiated from specific pages. This allows you to discover which content and pages drive user engagement with your site.
Fascinating, isn’t it? Were you already leveraging any of these metrics to evaluate your content’s success?
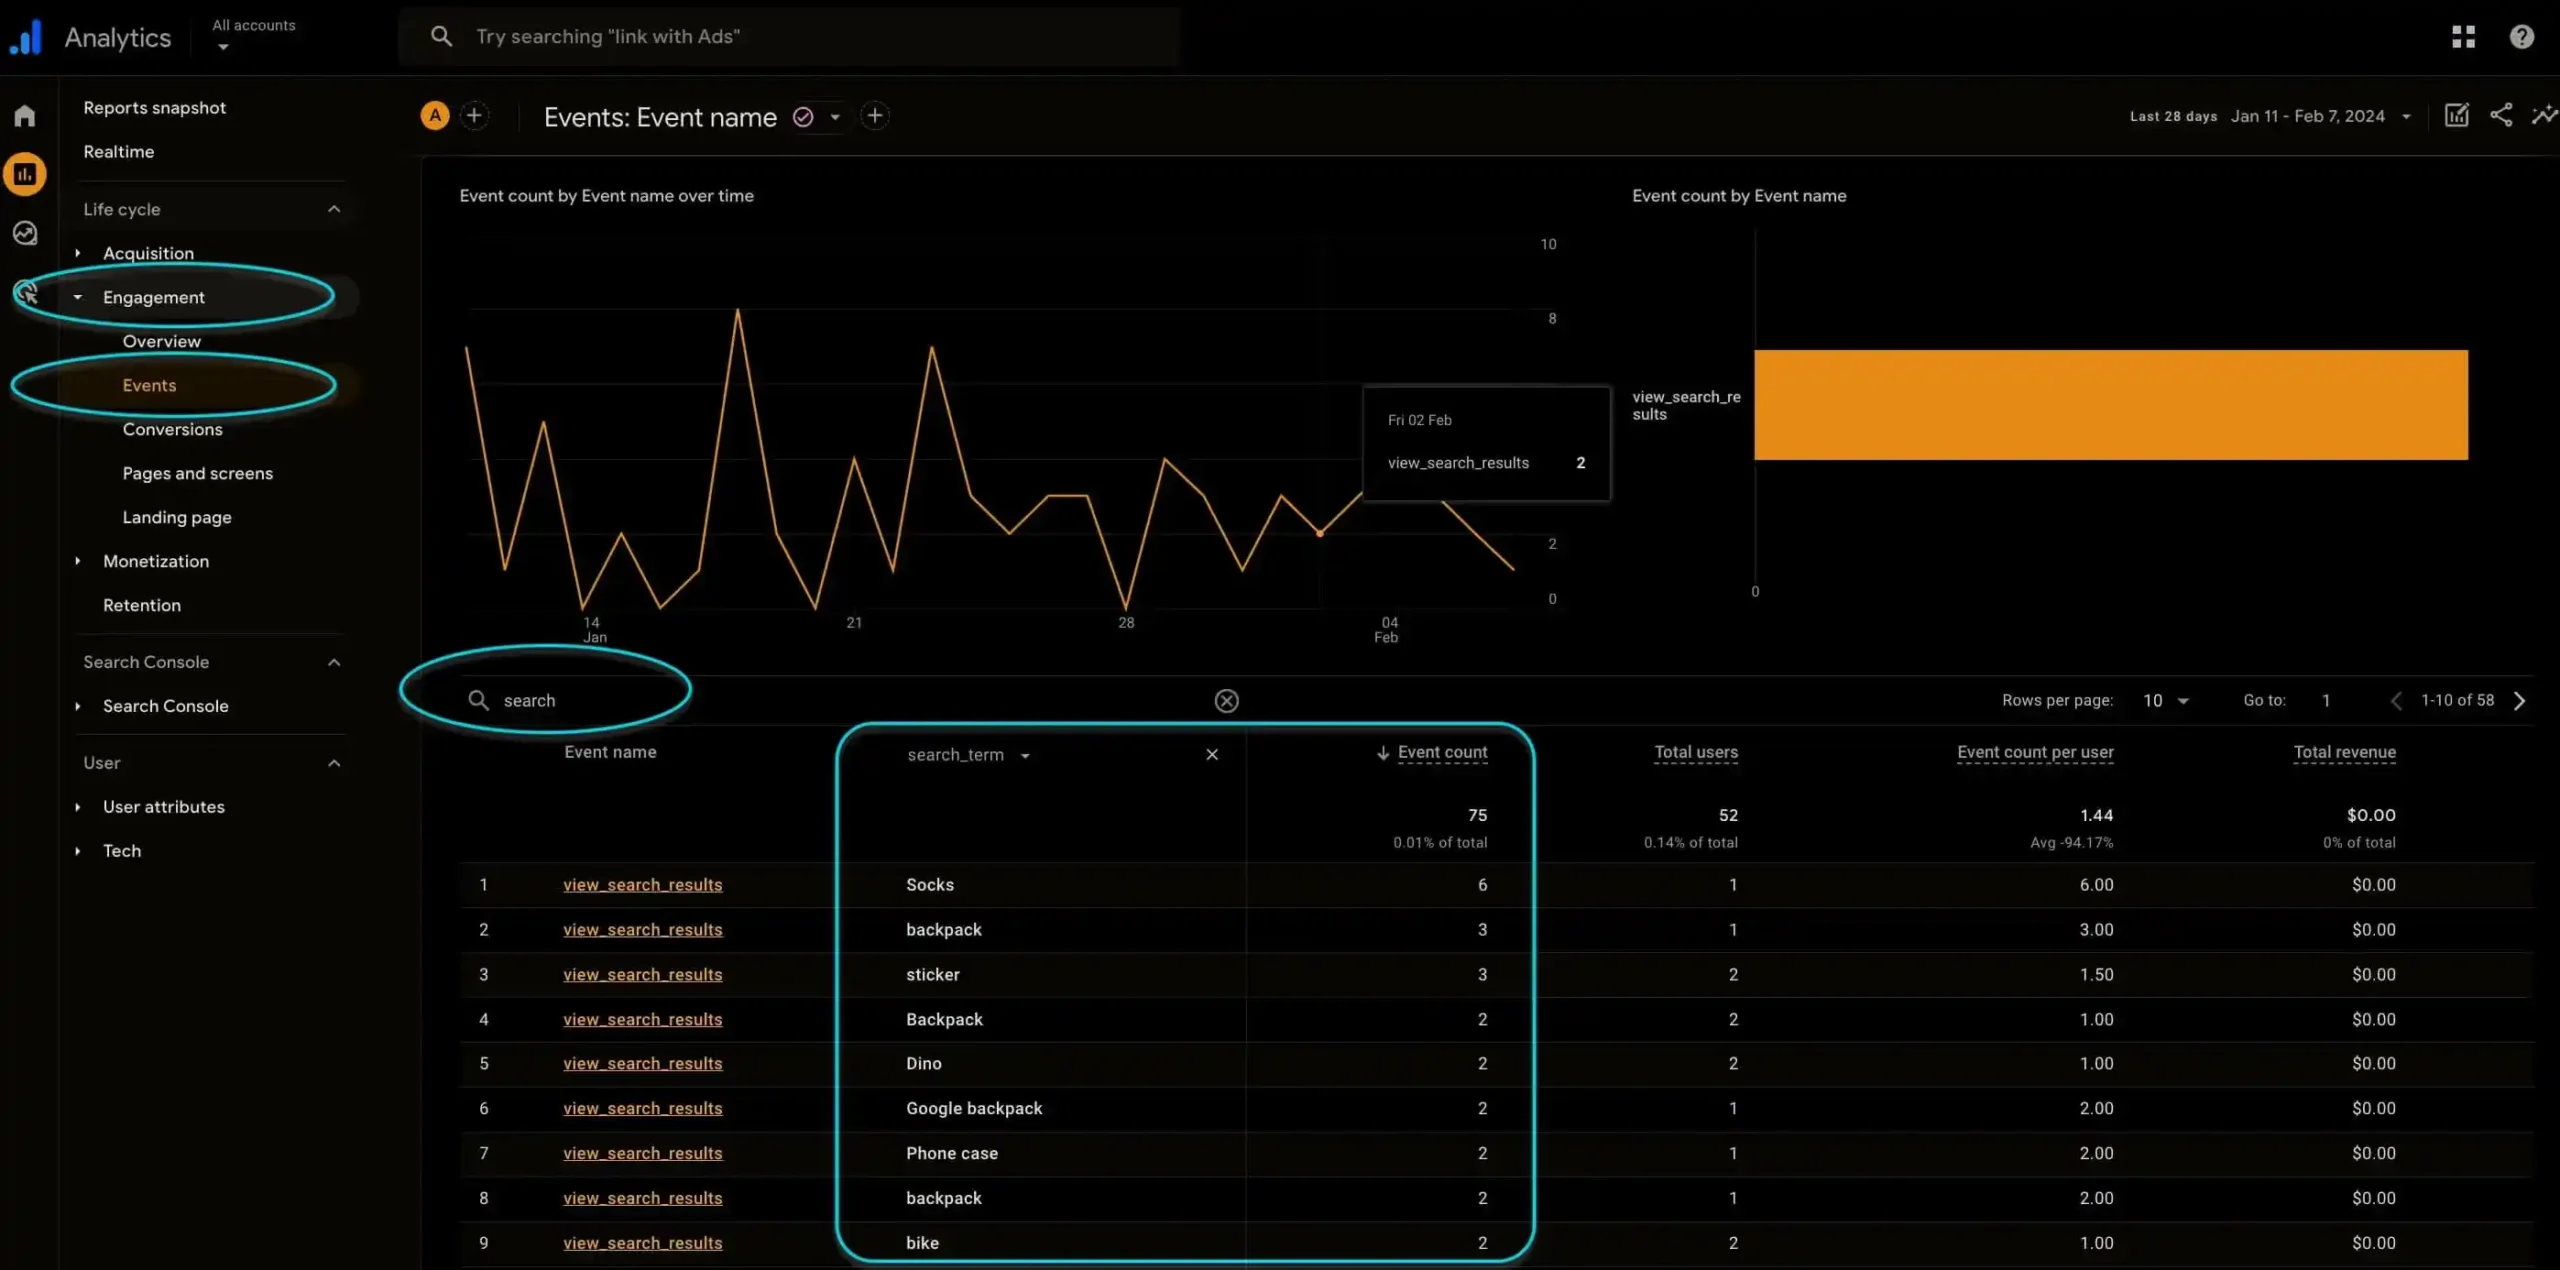
4. Unlocking Insights: Using GA4 to Understand User Search Behavior
Another useful report in GA4 is the internal site search report, it reveals what your readers are most interested in. If you have an internal search engine, you can use the collected data to understand the most searched topics and the terms users use to refer to them.
How to Identify Content That Works and Content That Doesn’t
Interpreting data from Google Analytics reports is crucial for refining your content strategy and creating engaging content for your audience.
Let’s review the reports that will become your daily companions:
- First of all, analyze the number of pageviews for each page of your website and identify those with the most success. These pages could suggest the most interesting topics for your audience.
- Observe the average session duration and bounce rate for each page. If a particular content has a high average session duration and a low bounce rate, it means that users find it interesting and engaging.
- Create meaningful events and use the “Events” report to understand how users interact with your content. For example, if you notice that many users click on a specific link or button on the page, it means that content has caught their attention.
With these data, you can understand which pages are most successful and which ones are not capturing the audience’s attention.
If, on the other hand, a content receives a lot of visits, has a good duration, but hardly ever converts, perhaps the problem is not the content, but the usability of the page and UX optimization to achieve conversions. In this case, you should expand the analysis to investigate any bugs and possible layout and CRO optimizations of the site.
Don’t forget to also use the information provided by the “Internal Search” report, so if you notice that many users are searching for a specific keyword within your site, it may be time to create new content targeted at that specific topic.
Bonus Tip for Supercharging Your Content Strategy
Now that we’ve explored how to leverage Google Analytics for content improvement, let’s dive deeper into analyzing content performance. With the insights provided by these reports, you can discern which content resonates best with your audience and pinpoint areas needing enhancement.
Always pay attention to current trends and strive to anticipate your readers’ interests. Analyze comments and interactions on social networks to assess your audience preferences and identify content that generates significant engagement. Analyze queries from search engines, i.e. through Google Search Console or Bing Webmaster Tools, to understand what users are searching the most.
Utilize this information to develop fresh, impactful content tailored to your audience’s needs and current trends. Be consistent in monitoring content performance and making adjustments as necessary based on your findings. By doing so, you can continually refine your online marketing strategy and achieve remarkable results.
If you found this article helpful, follow us on LinkedIn. You’ll find new useful and interesting content to enhance your marketing strategies and operations. And if you need an expert to help you understand report settings, tracking your website, or optimizing your digital marketing strategy, feel free to reach out.